Rankings
Port Data
| Rank | Port Name | City | Type of Freight | TEUs 2022 | TEUs 2021 | % Change | Freight Tonnage (metric tons) |
|---|---|---|---|---|---|---|---|
| 1 | Port of Los Angeles | Los Angeles | container, break bulk, dry bulk, liquid bulk, automotive, heavy lift, special project cargo, refrigerated, passenger | 9,911,159 | 10,677,610 | -7.2% | 219,000,000* |
| 2 | Port of New York and New Jersey | New York | container, break bulk, dry bulk, liquid bulk, automotive, heavy lift, special project cargo, refrigerated, passenger | 9,493,664 | 8,985,929 | 5.7% | |
| 3 | Port of Long Beach | Long Beach, Calif. | container, break bulk, dry bulk, liquid bulk, automotive, heavy lift, special project cargo, refrigerated, passenger | 9,133,657 | 9,384,368 | -2.7% | 193,354,062 |
| 4 | Port of Savannah | Savannah, Ga. | container, break bulk, heavy lift, automobile, refrigerated | 5,892,131 | 5,613,163 | 5.0% | 38,459,904 |
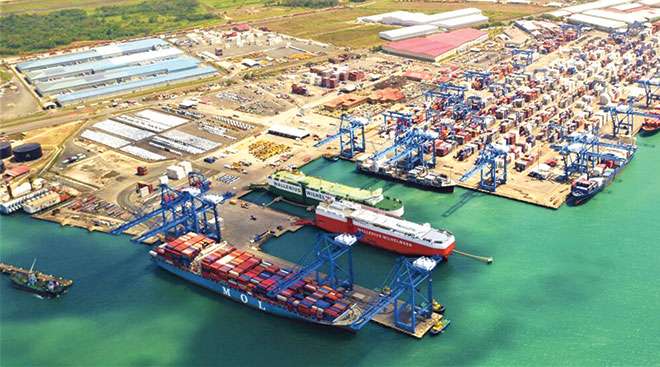
| 5 | Ports of Colon, Cristobal and Manzanillo | Colón, Panama | container, liquid bulk, dry bulk, passenger, transshipping | 5,058,556 | 4,915,975 | 2.9% | |
| 6 | Port Houston | Houston | container, break bulk, dry bulk, liquid bulk | 3,974,901 | 3,453,226 | 15.1% | 49,950,465 |
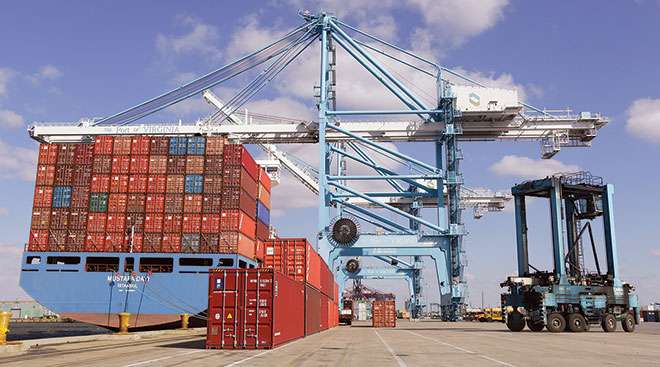
| 7 | Port of Virginia | Norfolk, Va. | container, break bulk, dry bulk, liquid bulk, automobile | 3,703,231 | 3,522,834 | 5.1% | 59,398,828 |
| 8 | Port of Vancouver | Vancouver, British Columbia | container, break bulk, dry bulk, liquid bulk, automobile, special project cargo, passenger | 3,557,294 | 3,678,952 | -3.3% | 142,469,186 |
| 9 | Port of Manzanillo | Manzanillo, Colima, Mexico | container, dry bulk, liquid bulk | 3,473,852 | 3,371,438 | 3.0% | 34,434,272 |
| 10 | Northwest Seaport Alliance | Seattle and Tacoma, Wash. | container, break bulk, liquid bulk, dry bulk, automobile, heavy lift, special project cargo, refrigerated, passenger, air cargo | 3,384,018 | 3,736,206 | -9.4% | 24,551,174 |
| 11 | Port of Balboa/PSA Panama International Terminal | Panama Int'l Terminals, Panama | container, transshipping | 3,347,861 | 3,561,432 | -6.0% | |
| 12 | Port of Charleston | Charleston, S.C. | container, break bulk, dry bulk, automobile, refrigerated | 2,792,313 | 2,751,442 | 1.5% | |
| 13 | Port of Oakland | Oakland, Calif. | container | 2,337,607 | 2,448,243 | -4.5% | |
| 14 | Port of Kingston | Kingston, Jamaica | container, heavy lift, liquid bulk | 2,137,500 | 1,975,401 | 8.2% | |
| 15 | Port of Montreal | Montreal | container, break bulk, dry bulk, liquid bulk, passenger | 1,722,704 | 1,728,114 | -0.3% | 35,997,337 |
| 16 | Port of Lázaro Cárdenas | Lázaro Cárdenas, Michoacán, Mexico | container, break bulk, dry bulk, liquid bulk, transshipping | 1,700,000 | 1,686,076 | 0.8% | |
| 17 | Port of Freeport | Freeport, Bahamas | container, passenger | 1,574,200 | 1,642,780 | -4.2% | |
| 18 | Port of Caucedo | Caucedo, Dominican Republic | container, refrigerated, transshipping | 1,406,500 | 1,250,000 | 12.5% | |
| 19 | Port of San Juan | San Juan, Puerto Rico | container | 1,398,600 | 1,438,738 | -2.8% | |
| 20 | Port of Jacksonville^ | Jacksonville, Fla. | container, break bulk, dry bulk, liquid bulk, automobile, heavy lift, refrigerated | 1,298,132 | 1,407,310 | -7.8% | 9,101,666 |
| 21 | Port Miami^ | Miami | container, passenger | 1,197,663 | 1,254,062 | -4.5% | 9,267,587 |
| 22 | Moín Container Terminal | Límon, Costa Rica | container | 1,182,854 | 1,319,372 | -10.3% | |
| 23 | Port Everglades | Broward County, Fla. | container, break bulk, dry bulk, liquid bulk, passenger | 1,107,546 | 1,038,179 | 6.7% | 24,129,601 |
| 24 | Port of Baltimore | Baltimore | container, break bulk, dry bulk, liquid bulk, automobile, refrigerated, passenger | 1,069,421 | 1,022,683 | 4.6% | 10,307,241 |
| 25 | Port of Prince Rupert | Prince Rupert, British Columbia | container, break bulk, dry bulk, liquid bulk, special project cargo, passenger | 1,035,639 | 1,054,836 | -1.8% | 24,593,720 |
| NOTE: Data for the ports of Kingston, Freeport, Caucedo and San Juan are via PortEconomics. Data for the Port of Lázaro Cárdenas is via the American Journal of Transportation. All other data is via port authorities. * Freight tonnage for the Port of Los Angeles is for fiscal year 2021-22, ended June 30, 2022. ^ Data for the Port of Jacksonville and Port Miami is for fiscal year 2021-22, ended Sept. 30, 2022. |
|||||||
Amazon Reports Boost in Quarterly Profit to $13.5 Billion
Amazon reported a boost in its quarterly profits Aug. 1, but the company missed revenue estimates, sending stocks lower in after-hours trading.
August 1, 2024Sluggish Global Economy Weighs on Germany’s DHL in Q2
FRANKFURT — German logistics and delivery giant DHL reported second-quarter net profit of $802 million, a decline of 23.9% from a year ago, as a sluggish global economy dampened demand.
August 1, 2024Maersk Boosts Full-Year Guidance
A.P. Moller-Maersk, a bellwether for global trade, increased its full-year guidance due to higher freight rates caused by supply chain disruptions following attacks in the Red Sea.
August 1, 2024FAA Clears Drone Companies to Operate in Shared Airspace
The FAA has cleared Wing and Zipline to fly their drones simultaneously over the suburbs of Dallas-Fort Worth without visual observers, using technology to keep the drones apart.
July 30, 2024Amazon Deemed Responsible for Hazardous Third-Party Items
Amazon is responsible under federal safety law for hazardous products sold on its platform by third-party sellers and shipped by the company, a U.S. government agency ordered July 30.
July 30, 2024CMA CGM Reports Solid Volumes, Sees Rates Peaking
CMA CGM SA reported a second-quarter jump in cargo volumes and signaled freight rates have probably peaked for now despite bottlenecks at Mediterranean ports.
July 26, 2024Union Pacific Profit Grows 7%
OMAHA, Neb. — Union Pacific delivered 7% growth in its second-quarter profit even though the number of shipments it hauled remained essentially flat.
July 25, 2024UPS Discusses Acquisition of Parcel Carrier in Mexico
The recently announced UPS acquisition of Mexican express delivery company Estafeta takes advantage of a business trend toward nearshoring.
July 24, 2024Amazon Prime Day Drives Online Sales Up 11% to $14.2 Billion
U.S. shoppers spent $14.2 billion online during Amazon.com Inc.’s 48-hour Prime Day sale, up 11% from a year ago and in line with estimates, according to Adobe Inc.
July 18, 2024Port of Baltimore Terminal to Have $1.54B Impact, Study Finds
The planned Sparrows Point terminal is expected to transform Maryland’s economy over a decade, generating more than 8,000 jobs and adding $1.54 billion a year in economic impact.
July 17, 2024


